Since its launch in 2005, Google Analytics (GA) has become so widely used that it now appears on 86% of the top 100,000 websites in the United States[1]. How did it become so popular? For two main reasons: its convenience and its cost. Once you’ve signed up (for free), you can install it by pasting a script tag and four lines of JavaScript into your site’s HTML. You now have the power to track whenever anyone visits your website, where they came from (both virtually and geographically), what pages they looked at, and for how long they stuck around. But this power doesn’t come for free: you may not be spending any money, but your users are paying in other ways.
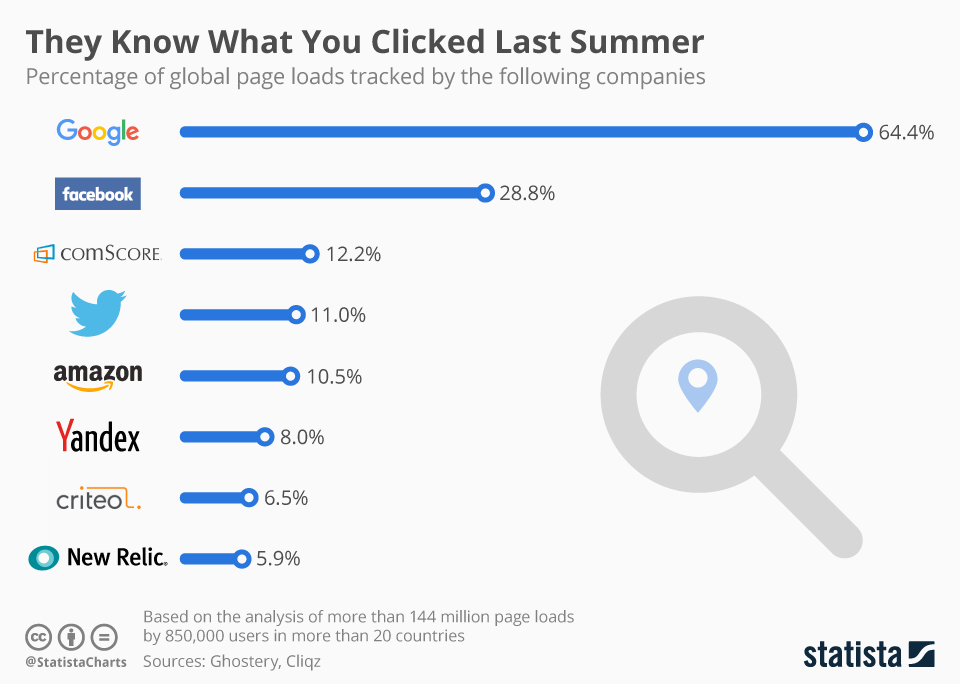
Of course, Google isn’t the only company involved in the analytics business, but they collect more data from more users than anyone else. According to this graphic from 2017, Google were tracking 64.4% of all page loads across the whole web[2]; three years later, that figure is now probably even higher.
After recently deciding to remove all the client-side JavaScript from my own website, I had a decision to make: either stop tracking visitor numbers entirely, or look for an alternative to GA. Fortunately, there are a number of other ways to measure the popularity of my site that have far less (or even zero) impact on end users. In this post, I’ll cover the main problems with GA and explore some alternatives.
The downsides
Let’s look at some of the frequently mentioned downsides of using GA and determine their impact:
It’s not accurate
A quick search gives me a figure from 2018 of 27%[3] of web users using an ad blocker. A more recent study suggests that this figure is 40% on desktop and 22% on mobile[4]. Some ad blockers such as uBlock origin block all tracking JS by default (including GA) and even those that don’t block GA by default can often be configured to do so. There are now also privacy controls built into browsers like Safari and Firefox which break certain tracking features by disabling cross-site-tracking cookies (these are what allow ads to follow you around the web after you’ve looked at a product). What does this mean for your analytics numbers? It means you’re going to miss a significant amount of visitors and if your site is one with a tech-savvy audience (e.g. a blog about web development), that number is probably even higher.
This one is a definite yes: the numbers you get from GA are wrong and it’s difficult to say exactly how wrong they are.
It’s bad for performance
If you’re using the method currently recommended by Google to install GA on your site, each of your users will be downloading the gtag.js library which is 34.72kB of (compressed) JavaScript[5] and analytics.js which is 18.4kB[6]. For comparison, that’s larger than many popular JavaScript libraries including Vue (22.8kB) or jQuery (30.4kB)[7], and over twice as large as the previously recommended method of loading analytics.js on its own.
I’ve seen it argued that this isn’t a big deal because of the way browsers cache files between requests. To confirm whether this assumption is correct, I opened a new incognito window in Chrome, opened the network tab and then navigated to five different websites which I knew used GA: while gtag.js appeared as a 34.72kB download on the first site, and analytics.js showed up as being 18.4kB, for the next four sites both files showed up as '(disk cache)', meaning the locally downloaded version was being used instead. However, Google sets a Cache-Control max-age header of only two hours for analytics.js and only fifteen minutes for gtag.js, meaning that after that time the version in the cache is invalid and the file must be downloaded again.
There was a time when websites using Google Analytics were unable to score 100/100 on Google’s own PageSpeed benchmark (the predecessor to Lighthouse) because of this short cache period[8], leading certain performance-minded developers to host the analytics.js library on their own server with a longer cache period. However, this negates the benefit mentioned above, where the file can be cached between different sites.
I’ll mark this one as a yes, but with the caveat that for some visitors it won’t be an issue: you’re still forcing those visitors without a cached version to download multiple libraries which provide them with zero perceptible benefits. It’s also worth mentioning that GA often isn’t the only third-party tracking JavaScript installed on a site. A 2018 study by Pingdom, showed that the average news site loads over 40 trackers and the impact of all those trackers is an increase in the average page load time of 6.77 seconds[9].
It’s bad for privacy
By default, GA harvests a wide variety of data from users, including IP addresses, regardless of whether you have your users’ permission to do so. Efforts by governments, like the EU’s General Data Protection Regulation (GDPR), have attempted to reduce this kind of harvesting of personal information without good reason; but big tech companies are always looking for loopholes which allow them to carry on these practices. If you’ve ever been overwhelmed by the options on a cookie consent dialog, that’s intentional — these are usually designed to either trick you or bore you into sharing more data than you’re comfortable doing, with as many third parties as possible.
Here’s an excerpt from ‘How Google uses information from sites or apps that use our services’:
Google uses the information shared by sites and apps to deliver our services, maintain and improve them, develop new services, measure the effectiveness of advertising, protect against fraud and abuse, and personalize content and ads you see on Google and on our partners’ sites and apps.[10]
When you install GA on your site, you’re basically giving Google free rein to use any data they collect for whatever purpose they choose. One of these purposes Google is somewhat open about is 'Ad personalization' — this is where data collected from multiple sources is combined to build an ‘ad profile’ containing your demographic data and interests. This is then used ‘to make your ads more useful for you’. These personalised, ‘more useful’ ads are shown with the aim of increasing conversions (i.e. clicks and sales), based on the idea you’re more likely to engage with something that’s relevant to your interests. A higher conversion rate means Google can charge higher fees to advertisers for the same ad space.
This is another definite yes: the negative impact on privacy caused by GA is undeniable and is something you should be open with your visitors about. The Google Analytics Terms of Service include the following line: “You must post a Privacy Policy and that Privacy Policy must provide notice of Your use of cookies…” — if you’re using GA without making this clear in your privacy policy (you do have a privacy policy, right?), you’re not only violating GA’s terms and privacy regulations, but also your users’ trust.
The alternatives
Minimal Analytics
When Google Analytics runs in the browser it sends tracking events to an API. This means that you don’t have to use Google’s JavaScript: you can instead write your own or use one of many existing GA-compatible libraries to track only the things you need. A great example of this is the Minimal Google Analytics Snippet, a 1.5kB library that is small enough to paste directly into your website’s HTML with no external dependencies. For websites without complex requirements such as AdWords, this is just as effective (if not more effective, as it should load quicker) as gtag.js or analytics.js, but at a fraction of the size.
This mostly solves the potential performance issue, however, even though we’re not using Google’s JavaScript, we’re still sending data to their servers. This does nothing to fix the privacy issue and most ad blockers will be smart enough to intercept these requests.
Client-side alternatives
If you want the features of GA but want to make a more ethical choice, there are plenty of offerings which claim to offer better privacy than GA. I won’t cover all of the available options here, but I will recommend this post by Josef Strzibny in which he covers both open source and hosted alternatives. These generally have much smaller file sizes and collect far less data than GA, but are still liable to be blocked by ad-blockers.
I’ve recently replaced GA with Plausible on the Component Gallery: it’s open source, lightweight (835 bytes), it captures the bare minimum of data, and it even comes with a 30 day free trial (after that, it costs $6 a month or $4 if paying annually). I can’t say whether it’s the best privacy-focused client-side analytics service because I haven’t tried them all, but I’d tend to favour those services that have made their code open source over those which haven’t. Open source analytics programs have the benefit that you can choose to host the program yourself without paying a subscription fee. You can also inspect the source code to get a better idea of how much data they’re collecting.
For hosted services I’d be more inclined to choose a service which charges a fee. While no company should be taken at their word without a healthy pinch of scepticism, it’s easier to understand the business model of a service which charges a subscription fee than one that gives it away for free — with a free service, you could be paying with your users’ data. That said, it’s unlikely that any service is doing anything with data on the scale of Google. If you’re strongly against paying a subscription fee for analytics, GoatCounter offers a free tier (donations recommended, non-commercial use) for up to 100,000 pageviews per month.
Other sources of analytics data
Even without client-side analytics, users leave a trail when using the internet: if you make a search using Google, or click a link in a tweet, those platforms are recording that action. No single tool can give you a definitive measurement of how users arrive on your website, but there are still ways you can build up a picture from data that already exists: sites including Google search and Twitter provide a subset of the data they collect for you to use for your own purposes.
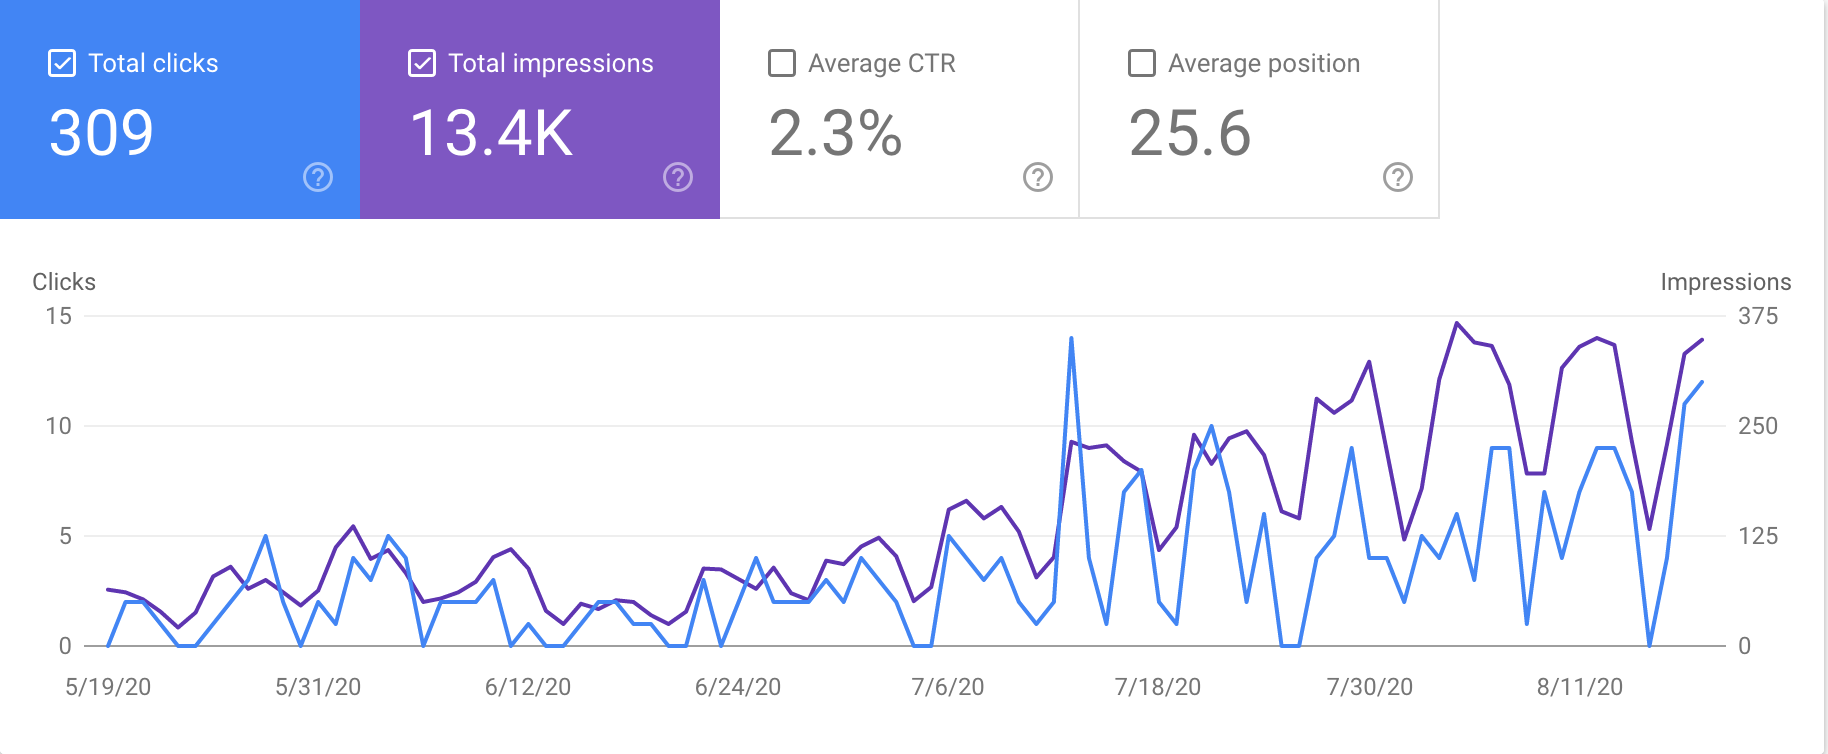
Google Search Console (shown above) allows you to track the terms used when visitors see your website in search results as well as the proportion of users who saw those links and went on to click them. It also lets you know which pages have been successfully crawled and which caused crawler errors. Unlike with GA, Google already has this data, so I personally don’t see this as anywhere near as harmful as actively collecting more data on Google’s behalf.
Google Search Console isn’t a replacement for analytics, in fact Google push you to link it with your GA account so the datasets from each platform can be combined. But if you don’t want to feed more data into Google’s ad revenue generating machine, using Search Console on its own may be enough to give you a good idea of how users are arriving on your site and what they’re looking for.
Netlify analytics
If you’re hosting your website on Netlify you can enable Netlify Analytics for $9 per site, per month. That might sound steep for a service you can get elsewhere for free, but Netlify’s server-side tracking is an entirely different offering from the client-side services previously mentioned:
- It doesn’t impact privacy. If you’ve ever explored the GA sidebar, you’ll have seen that GA collects a baffling array of location, demographic and acquisition data from your site users. GA can collect this because it runs custom JavaScript in the client’s browser. Netlify Analytics data is compiled from server request logs: it can’t use anything other than the data provided to it by regular HTTP requests from the browser.
- It doesn’t impact performance. All client-side analytics libraries mean forcing extra JavaScript on users when there’s no benefit to them, whereas code running only on the server will have zero impact on users.
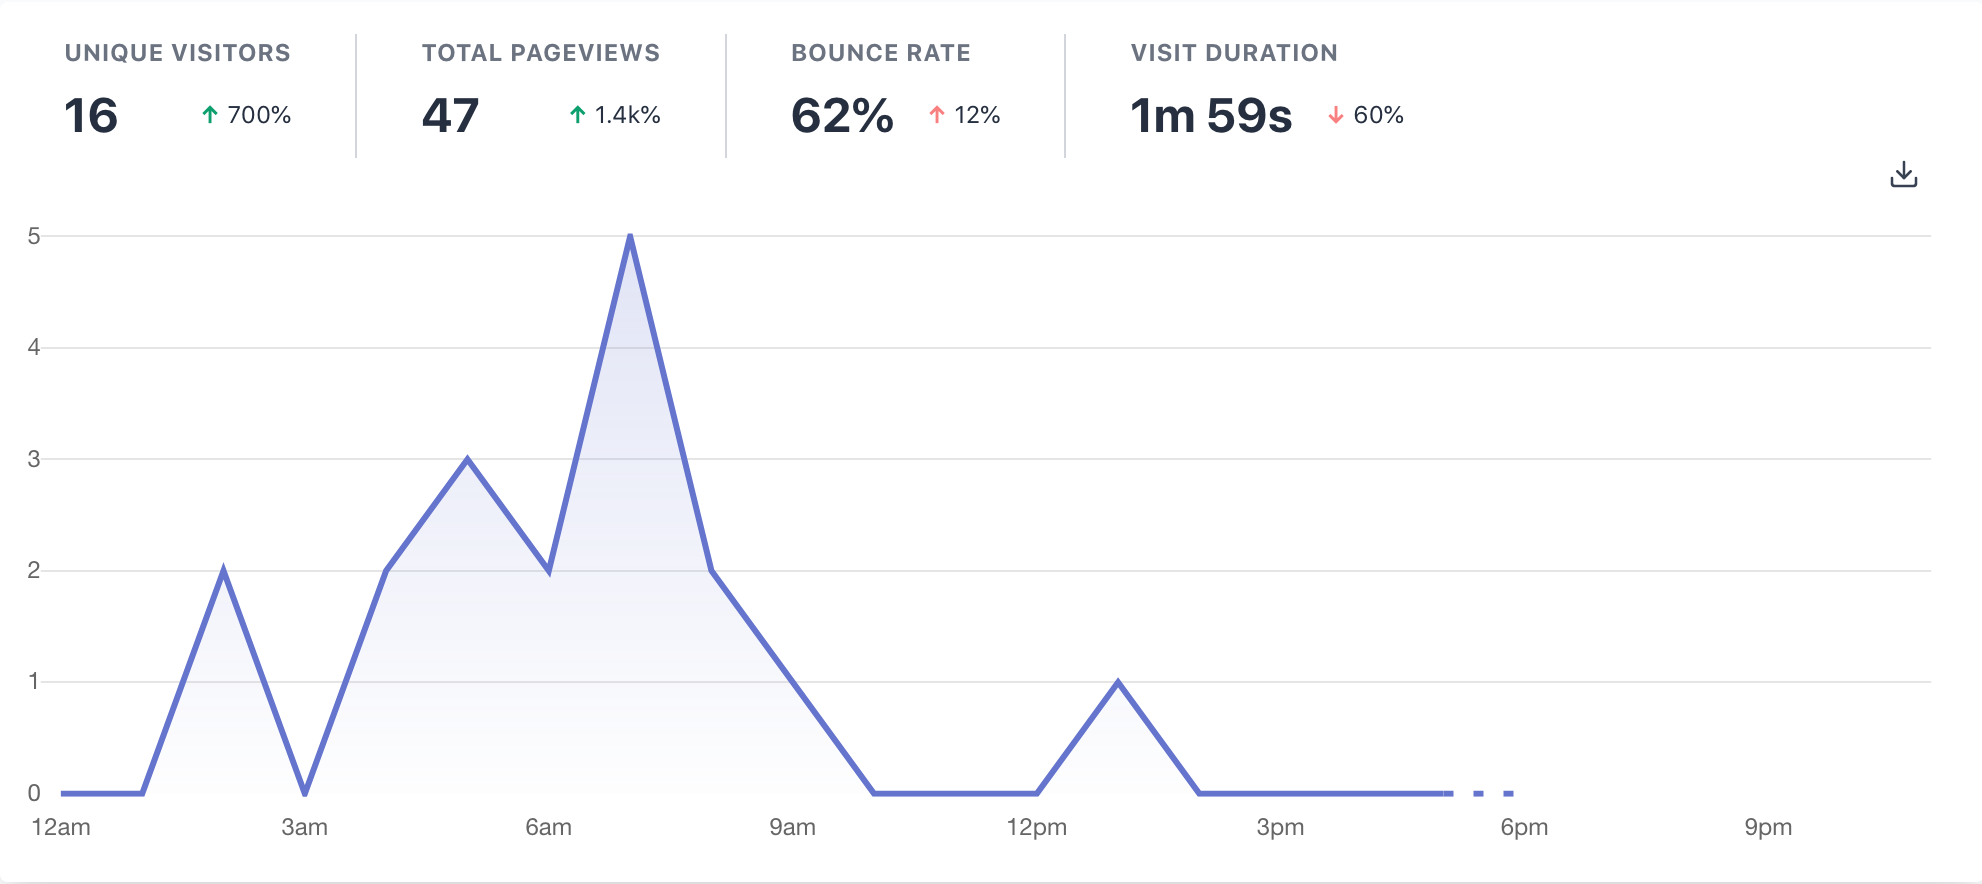
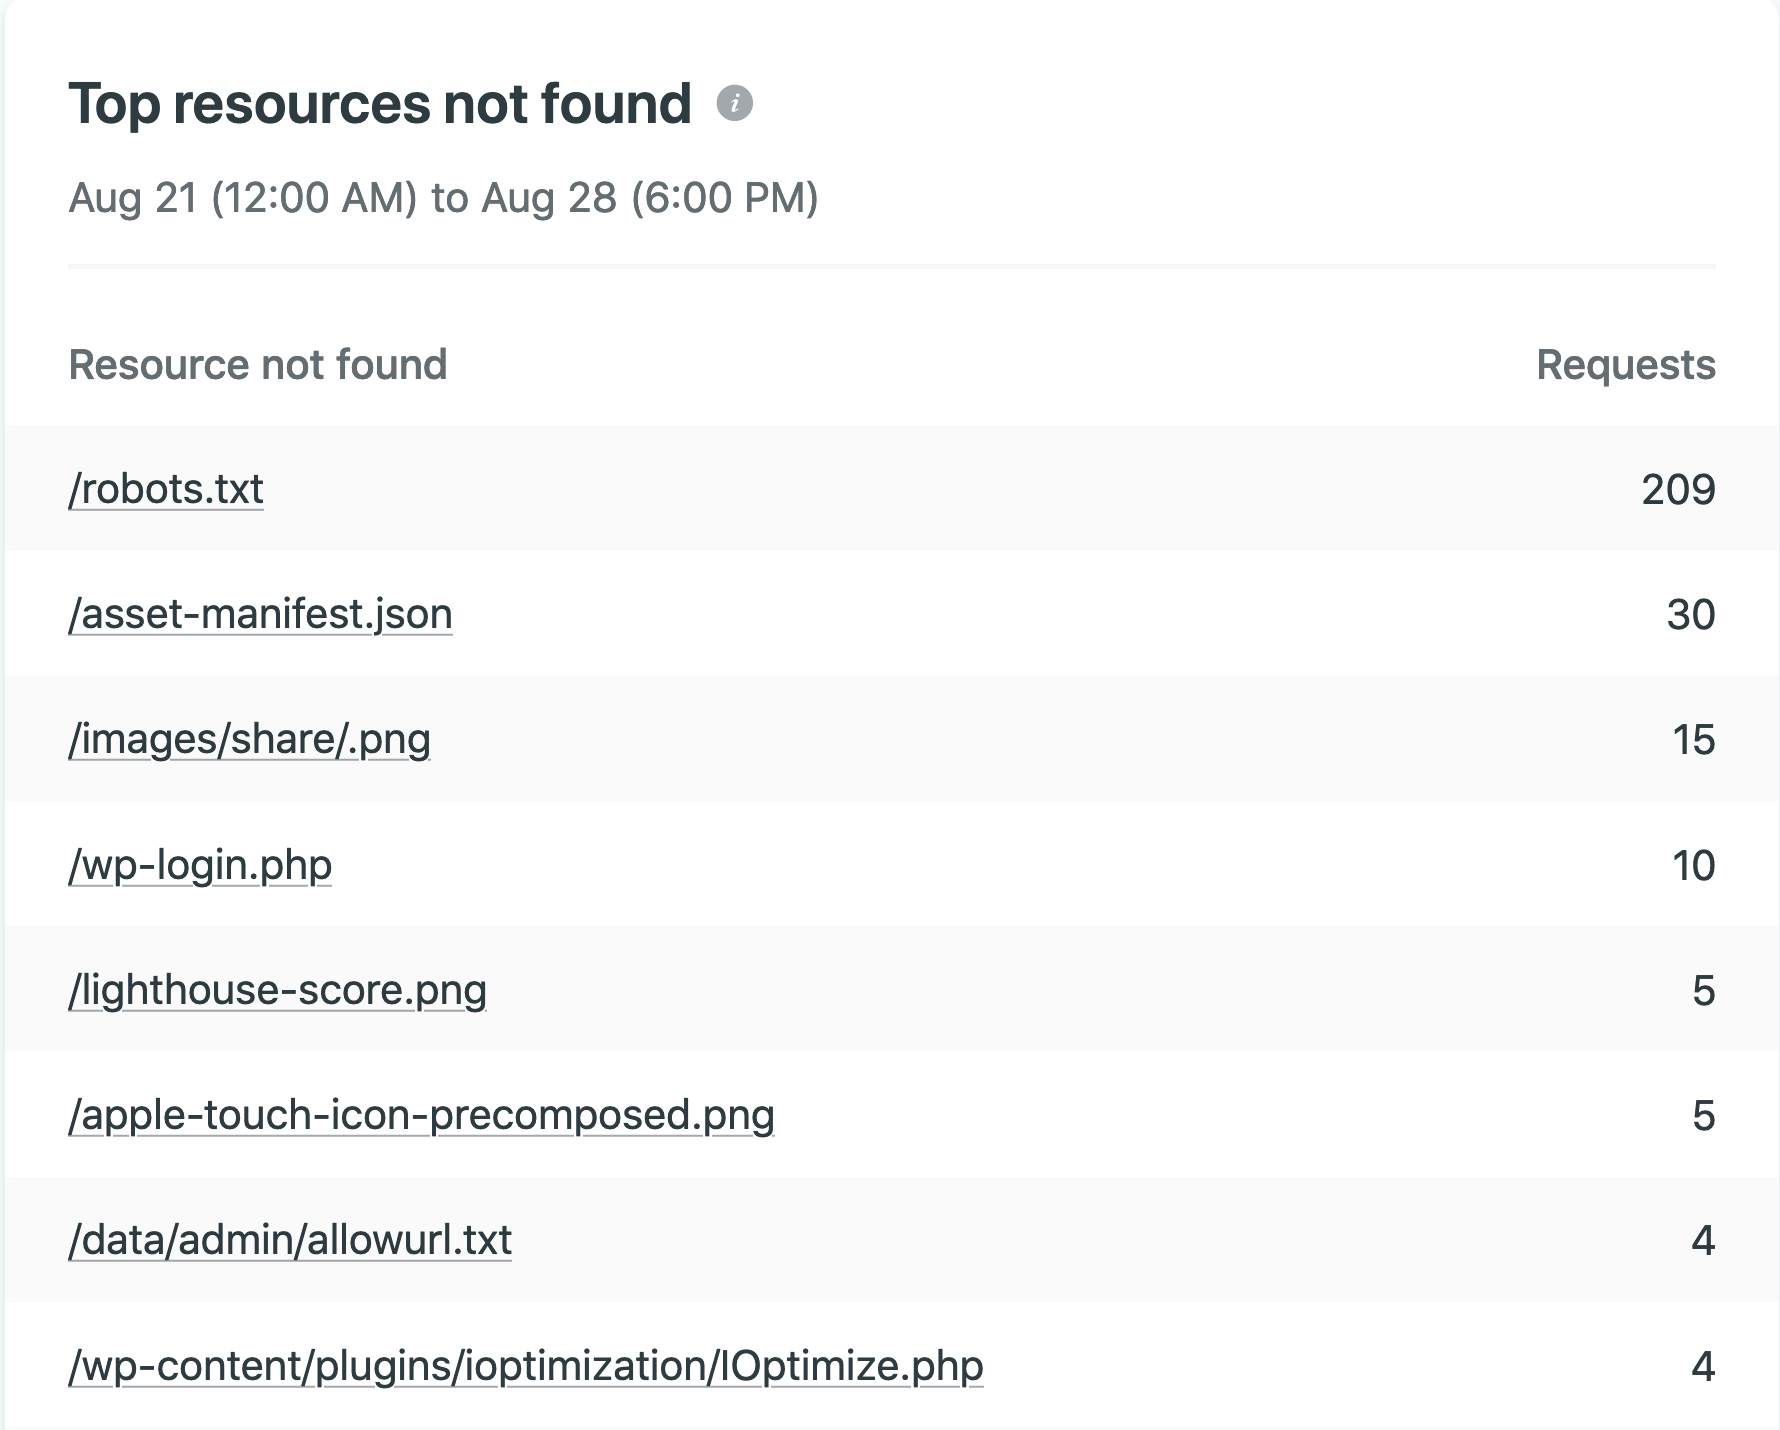
Compared to GA, the set of features is fairly minimal, but for small sites like my own personal blog, I’ve found it refreshingly simple to find the information I want. All the data for your site is shown on a single dashboard screen including graphs of visitor numbers over time, a list of top pages, and something I’ve found especially useful: a list of resources which returned the most 404 errors (something that server-side analytics is able to handle far better than client-side analytics).
There are some issues worth pointing out, perhaps the biggest of which is Netlify’s accuracy: compared to GA which seems to generally underestimate visitor numbers, because Netlify uses raw access logs it treats traffic from bots and aggregators (which don’t tend to run JavaScript) the same as genuine users, meaning your visitor numbers are artificially inflated with non-human visitors. While I appreciate how clean and free of configuration Netlify Analytics is, there are some glaring omissions: firstly, I’d like an option to filter out known bots based on user-agent string; I’d also like to see a method for viewing or exporting data older than 30 days — the lack of historical data makes it hard to do any serious data analysis.
If you aren’t using Netlify, there are other server-side analytics but most require some form of subscription fee. If you’re not afraid of some manual set up you could try AWStats, an open-source program written in Perl, which parses your server log files and builds an interface which you can use to explore your data.
What if I don’t have a choice?
Google Analytics is now so common that for many it’s become synonymous with the word, ‘analytics’. If you build websites for clients, chances are they will expect to be able to log in to ‘analytics’ using their Google account and see the familiar reporting interface. You may have other, more pressing battles you’d rather fight with a client: maybe they insist on using animated GIFs everywhere, or have a brand palette with only inaccessible colour combinations.
I’m not saying this data can’t be used for good: there are plenty of "top 10 benefits of Google Analytics" articles out there explaining how you can use GA data to make targeted improvements to your site. For example, you could try to improve the content on your most visited pages, or if the majority of your visitors are on mobile devices, you can focus your design on smaller screen sizes. If you’ve got to have it, at least use it to make your site better, but if you aren’t using it to drive improvements to your site, you’re better off without it.
I've found that for my own blog, a combination of Google Search Console, Twitter analytics and Netlify analytics provide me with enough information that I haven’t needed to look further. I’m lucky enough to be able to afford the $9/month fee but I understand that many people, including clients, will be hesitant to pay for something they can get for free elsewhere. It isn’t up to me to tell you whether the privacy of your website users is worth money out of your pocket, but I’d encourage you to ask yourself that question.
Google don’t give away analytics for free as an act of kindness: they’re still, primarily, an advertising company[11] and the more data they can feed into their ad-targeting algorithms, the more money they can make from selling ads. By giving up your users’ data voluntarily, you’re doing Google a favour, but doing your users a disservice.
Figure from Adblocking penetration rate in selected countries worldwide as of February 2018 ↩︎
Figures from Survey shows US ad-blocking usage is 40 percent on laptops, 15 percent on mobile — Marketing Land ↩︎
Size of the file, https://www.googletagmanager.com/gtag/js, measured 2020-08-21 ↩︎
Size of the file, https://www.google-analytics.com/analytics.js, measured 2020-08-21 ↩︎
Figures from Bundlephobia, GZipped ↩︎
PageSpeed Insights 99/100 because of Google Analytics - How can I cache GA? — Stack Overflow ↩︎
How 3rd Party Trackers Impact the Performance of the World’s Top News Sites, Pingdom ↩︎
How Google uses information from sites or apps that use our services ↩︎